New York City’s Environmental Footprint and COVID-19
Introduction
Brief Description
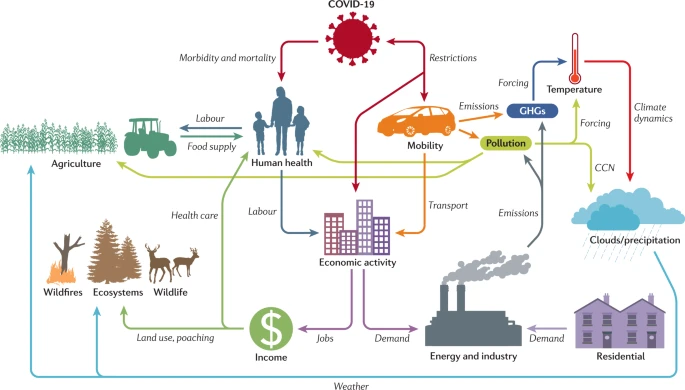
This project hypothesizes that there is a connections between NYC’s inactivity/shutdown during the pandemic and its effect on the environment. To establish these connections I will be using databases pertaining to gas prices and per capita expenditures to view New Yorker’s activity trends along with the city’s stationary, transportation, and waste emission trends. Through powerful tools such as pandas, SQL, regex, matplotlib, and other python methods, I am able to portray these pieces of data in a meaningful way, in which they show connections to each other and finally compute the correlations between them.

Relevance to NYC
This connects to NYC as it is a very dense city that was largely inactive due to the pandemic and the consequent shutdowns. As a big crowded city, New York’s environmental footprint is large, therefore this period of time of closure likely had an effect. The data used in this project pertain’s to NYC and seeks to highlight New Yorker’s overall activity before and after the pandemic as well as the city’s emission trends.
Information about the datasets and techniques used here.
Python Programs that produced visualizations and correlation data here.
Citations and Resources here.
Visuals
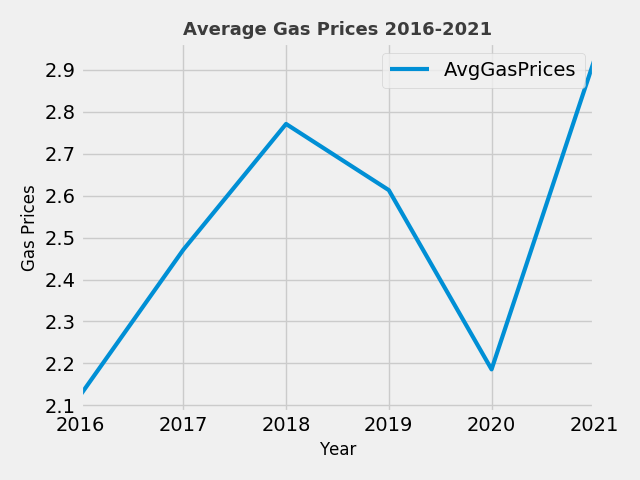
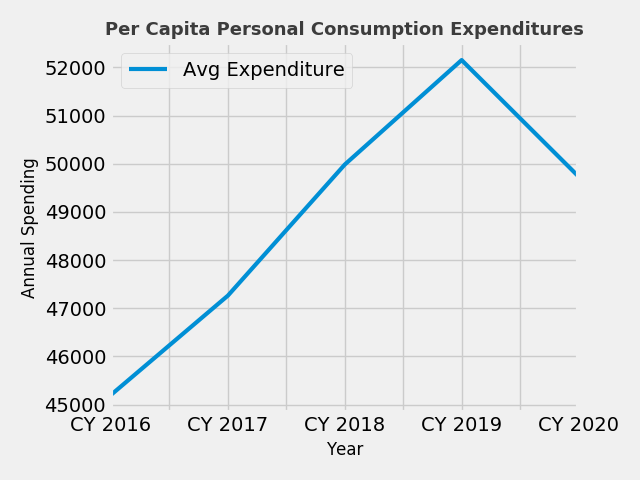
The following visuals show New Yorker’s activity from 2016-2021 in regards to average yearly gas prices and per capita expenditure
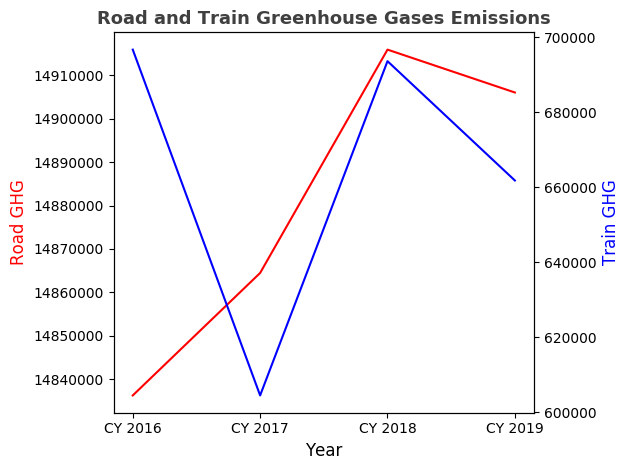
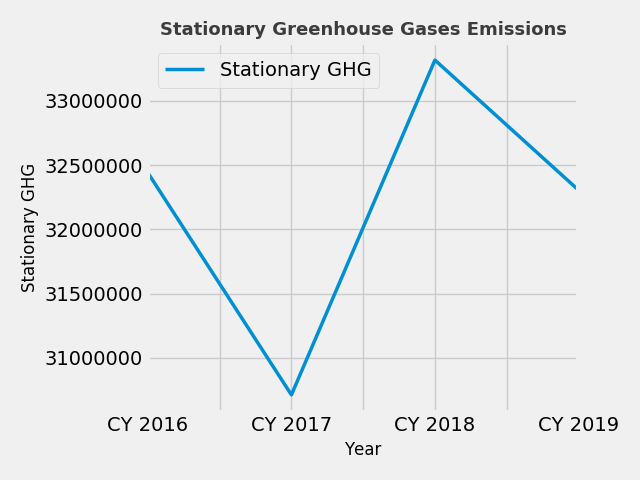
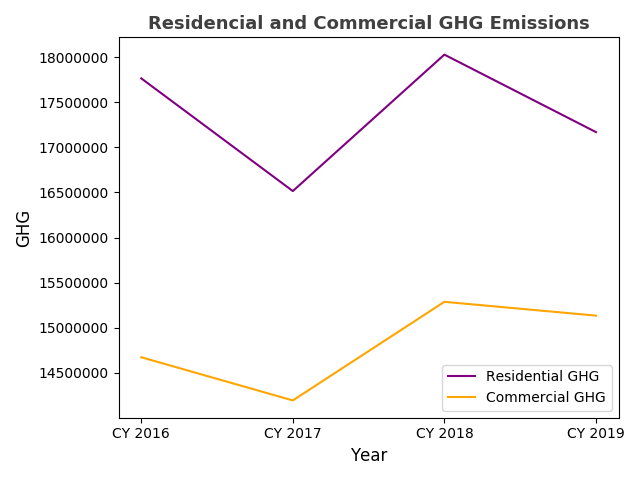
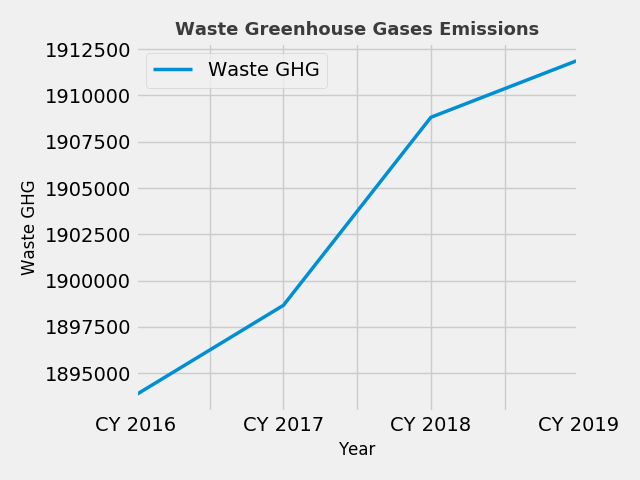
The following visuals show NYC’s Emission Data in regards to Transportation, Stationary, Waste emissions measured in GHG
![]()
Notes on the Visual above and the Data it derives from:
- Average Gas Prices is shown from 2016-2021. It is the average yearly gas price in NYC.
- Per Capita Personal Consumption Expenditures is the value of the goods and services purchased by New York residents.
- Transportation GHG shows the total tCO2e or GHG of vehicle/road and train transportation emitted by NYC 2016-2019
- Road and Train GHG separates the two modes of travel, as road travel far exceeds emissions of train travel
- Road travel includes: buses, heavy/medium trucks, passenger cars, and SWCV.
- Train travel includes: railway consumption of diesel and electricity
- Stationary GHG shows the total tCO2e or GHG emitted by residencies and commercial businesses in NYC 2016-2019
- Residential and Commercial GHG separates the two structures, as residential emissions exceed commercial emissions.
- Residential GHG’s include: different fuel oils, biofuel, electricity, natural gas and steam
- Commercial GHG’s include: different fuel oils, biofuel, electricity, natural gas and steam
- Waste GHG shows the total tCO2e or GHG emitted by landfills
Correlations
In order to examine if New Yorker’s activity (through gas prices and personal expenditure) is connected to the emissions released (through transportation, stationary and waste emissions), I proceeded to narrow the data to our available years from 2016-2019. This produced the following correlation statistics:
The following Correlations were found:
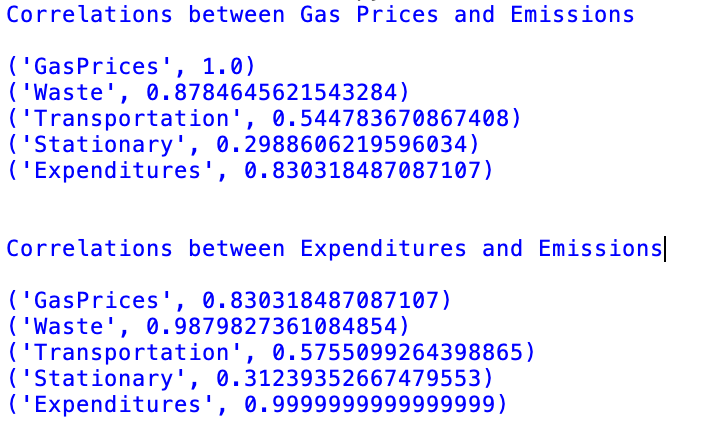
Correlations between Gas Prices and Emissions:
- Gas Prices and Waste: 0.8784645621543284
- Gas Prices and Transportation: 0.544783670867408
- Gas Prices and Stationary: 0.2988606219596034
Correlations between Personal Expenditures and Emissions:
- Annual Expenditure and Waste: 0.9879827361084854
- Annual Expenditure and Transportation: 0.5755099264398865
- Annual Expenditure and Stationary: 0.31239352667479553
Correlation between our measures of activity (Gas Prices and Expenditures):
- Gas Prices and Annual Expenditure: 0.830318487087107
Analysis
The gas prices dataset is the most important in analyzing our population’s consumption, usage, and general demand. This allows us to draw conclusions on how much New Yorkers are driving, their daily life activity as we went into quarantine, and will show their activity as we return to ordinary commutes and trips. Gas prices also signal economic changes as New Yorkers can spend more and are generally more involved in society’s economy. Important notes on gas patterns. If gas prices decrease, generally supply is surpassing the demand, which means people are driving less / buying less gas. (This pattern is seen in gas prices during the summer versus the winter: gas prices increase during the summer as more people drive and decrease in the winter as people generally drive less.) It is also important to keep in mind that gas prices may fluctuate due to external factors other than normal market behavior, such as new policies, oil leaks etc. Viewing the yearly average instead of specific pin points helps with these external factors.
Gas prices are strongly correlated to our second activity monitor - Expenditures (correlation: 0.83), although a much smaller dataset, it is the per capita personal consumption expenditures of the average New Yorker each year. Gas Prices and Expenditure are both related in signaling how much income the average New Yorker had and was able to spend.
Generally through the visuals shown above almost all elements showed growth from 2016 to 2019. Some such as our transportation and stationary data spiking in between with its highest points being in 2018 (it is important to take into consideration subgroups such as road travel vs. train travel which greatly differ). Among our emissions data we saw that waste GHG was very closely tied to our activity monitors, a correlation of 0.87 between gas prices and waste, and perhaps one of the most surprising and strongest correlation of 0.98 between expenditures and waste.
Overall this study has shown what environmental science has repeatedly proven - that more spending and interaction with the economy/society leads to more emissions/pollution.
This project analyzed data within a relatively short timeframe (2016-2019) yet our activity monitoring data and our emissions data proved to be very dynamic. This leads to a possible conclusion regarding trends during COVID-19. Due to the pandemic gas prices plummeted as the economy was largely shut down and people remained home. Tied to the very dynamic trends we found, it can be predicted that the months/year of closure in NYC lead to less overall emissions and pollution.
Scientific Research has already began on the effects of COVID-19 closures and our Environment:
From the New York Daily News: Columbia University researchers are monitoring pollutant levels in Harlem and found 10% drops in carbon dioxide and methane in March, along with a shocking 50% plunge in carbon monoxide and levels of PM 2.5, the particulate matter that reduces visibility and causes an assortment of health issues, are down about 20% over the last month. “There’s no doubt reducing the amount of vehicle miles traveled last month had an impact in air quality in the region,” said Dan Westervelt, an associate research scientist at Columbia. “There definitely does appear to be a decrease (in pollutants).”